Custom WordPress Development – Performance Data From Real Business Websites
This page presents performance, maintainability, and search visibility data collected from 49 custom-built WordPress websites in active use by small and medium-sized businesses, alongside a comparison set of 20 template and page builder demo sites. All PageSpeed Insights measurements were taken on 19 April 2026. The custom sites were built by Ernest K. through Web Designer London between 2018 and 2026, and span 21 sectors. The purpose of publishing this data is to provide a practitioner benchmark for business owners, developers, and researchers weighing the trade-offs between custom WordPress development and template-based approaches.

Sample and methodology
The custom-build sample contains 49 live business websites. Sectors include construction (10 sites), hospitality (6), beauty (5), services (4), IT services, e-commerce, healthcare, food and drink, creative services, education, energy, finance, and several others. Sites range from 3 pages to 11,342 pages (a news archive). Plugin counts range from 3 to 38.
Within the 49 custom sites, 11 are flagged as “unoptimised” – typically older builds where the original brief was bespoke design without performance optimisation, or sites that have not been touched for several years. The remaining 38 sites form the “optimised custom” subset. Both groups are reported below so readers can draw their own conclusions.
The comparison set of 20 sites consists of publicly accessible demo sites for popular WordPress themes and page builders (The7, JupiterX, WoodMart, Bridge, Brooklyn, Avas, Qode, Essentials, TheGem, and others built on Elementor or WPBakery). These are the theme authors’ own showcase installations – in most cases, the fastest configurations those templates will ever run. Real client sites built on these themes typically perform worse due to added plugins, custom content, and production hosting. The direction of this bias favours templates in our measurements, which means any performance gap observed here is likely smaller than the real-world gap.
All numbers in the tables below are measured values, not estimates.
Industry context
To help readers interpret the practice-level numbers that follow, it helps to see where the wider WordPress ecosystem sits.
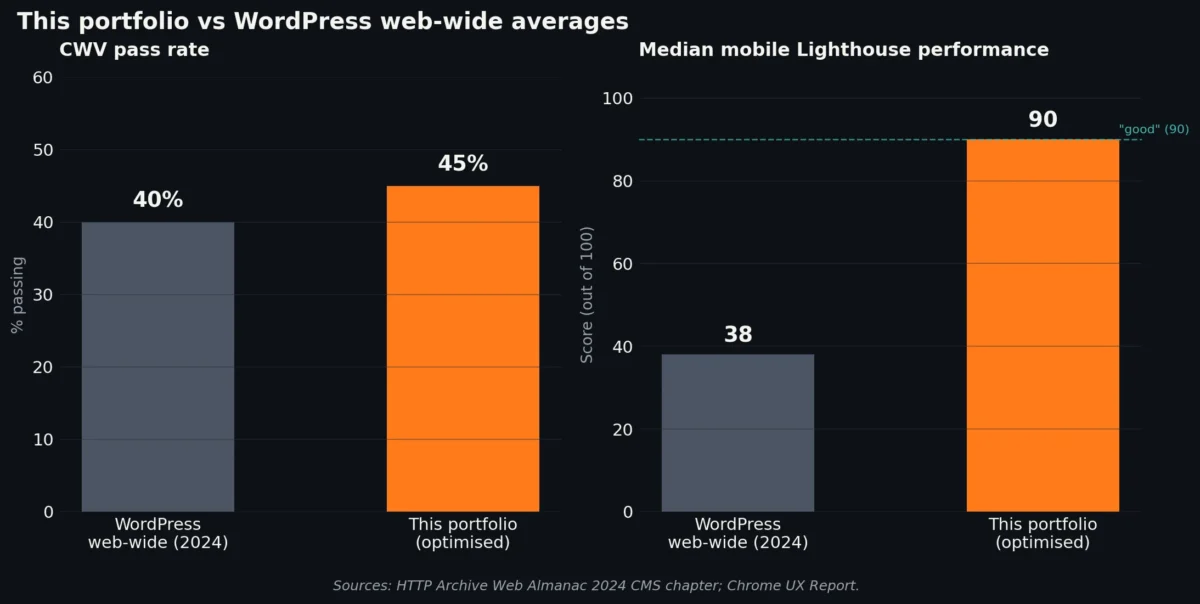
| Metric | WordPress (web-wide) | This portfolio (optimised subset) |
|---|---|---|
| Mobile CWV pass rate (2024) | 40% (up from 28% in 2023) | 45% (lab data, n=38) |
| Median mobile Lighthouse performance score | 38 / 100 | ~90 / 100 |
| Page builder use | ~60% of WordPress sites | 0% (all custom-coded) |
Sources: HTTP Archive Web Almanac 2024 and 2025 CMS chapters; Chrome UX Report.
The 2025 Web Almanac reports that Elementor holds roughly 43% of the page builder market, the native Block Editor 18%, WPBakery 13%, and Divi 10%. Custom-coded WordPress without a page builder – the approach used across this portfolio – is a minority position in the market but not a rare one.
When this research talks about “custom WordPress development”, the fair comparison is not against a perfectly configured theoretical WordPress site. It is against the ~60% of WordPress sites that fail Core Web Vitals at real-user level and the ~60% that run on page builders known to add measurable weight.
Performance comparison
PageSpeed Insights – mobile and desktop
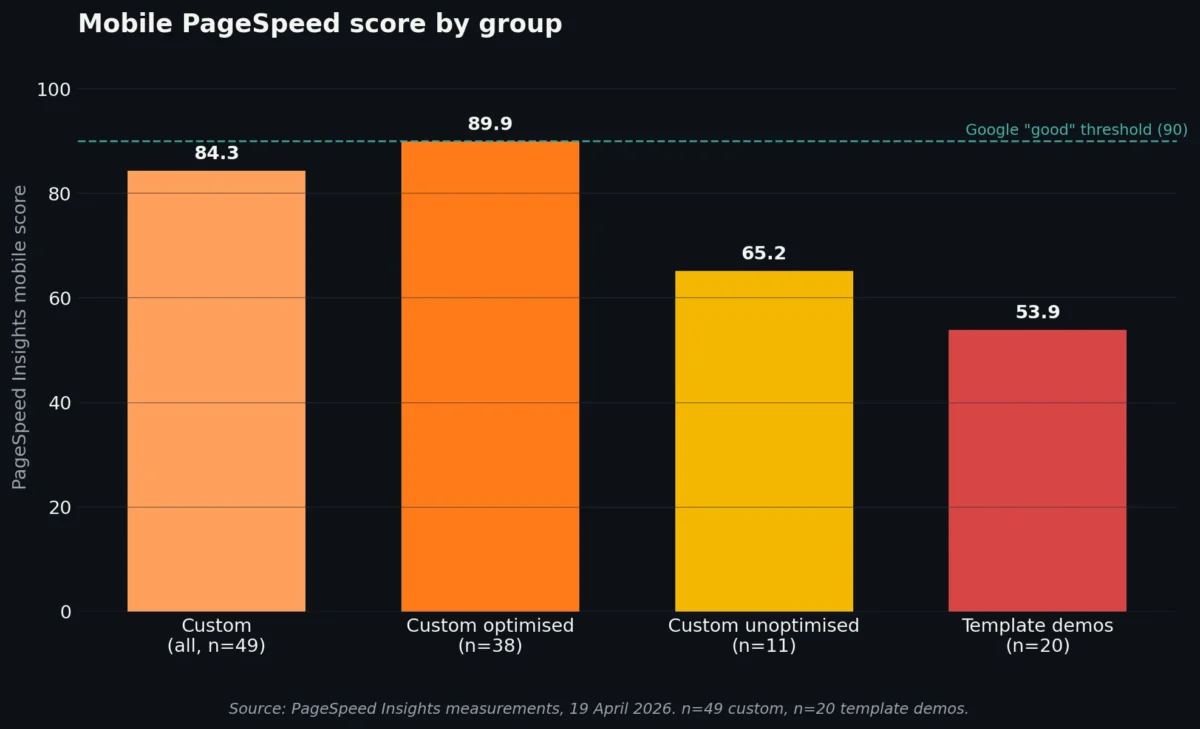
| Group | n | PSI Mobile (avg) | PSI Mobile (median) | PSI Desktop (avg) | PSI Desktop (median) | Sites scoring ≥90 mobile |
|---|---|---|---|---|---|---|
| Custom (all) | 49 | 84.3 | 89 | 94.3 | 98 | 24 / 49 (49%) |
| Custom (optimised subset) | 38 | 89.9 | 91 | 97.7 | 99 | 24 / 38 (63%) |
| Custom (unoptimised subset) | 11 | 65.2 | 69 | 82.5 | 82 | 0 / 11 |
| Template / builder demos | 20 | 53.9 | 56 | 67.0 | 72 | 0 / 20 |
The gap is clearest on mobile scores. The optimised custom subset averages 89.9 – essentially at Google’s “good” threshold of 90. The template demo set averages 53.9, roughly 36 points lower. Not a single template demo in the sample scored 90 or above on mobile, despite these being the theme authors’ own showcase environments.
Largest Contentful Paint distribution
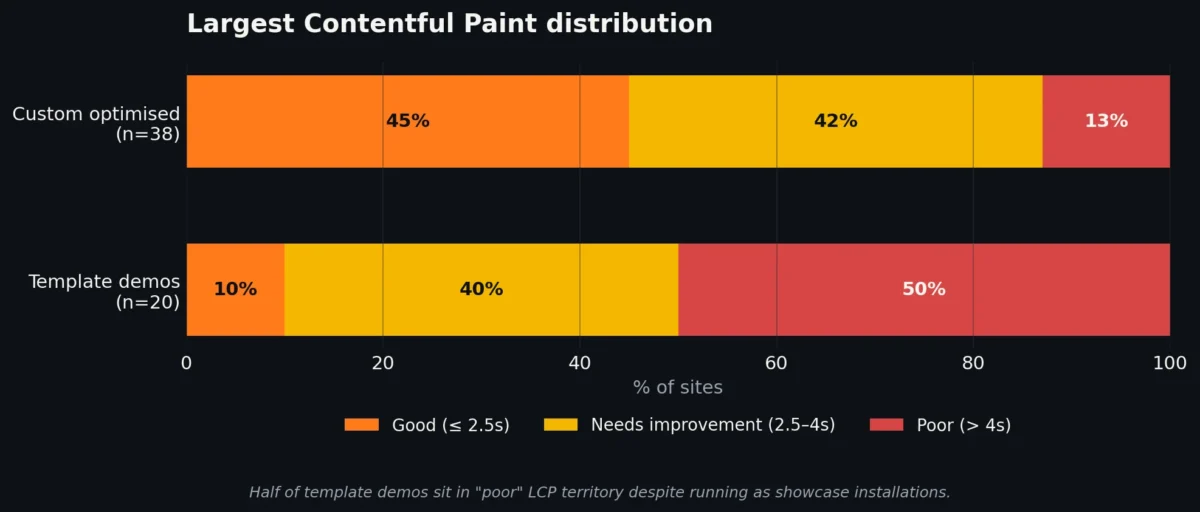
LCP is the single most-weighted speed metric in CWV. Here is how each group distributes against Google’s thresholds (good ≤2.5s, needs improvement 2.5-4s, poor >4s):
| Group | Good (≤2.5s) | Needs improvement (2.5-4s) | Poor (>4s) |
|---|---|---|---|
| Custom (optimised, n=38) | 17 (45%) | 16 (42%) | 5 (13%) |
| Template / builder demos (n=20) | 2 (10%) | 8 (40%) | 10 (50%) |
Half of the template demos land in “poor” LCP territory despite running as showcase installations. The custom optimised subset shifts the distribution meaningfully toward “good” and cuts the “poor” tail to 13%.
Cumulative Layout Shift
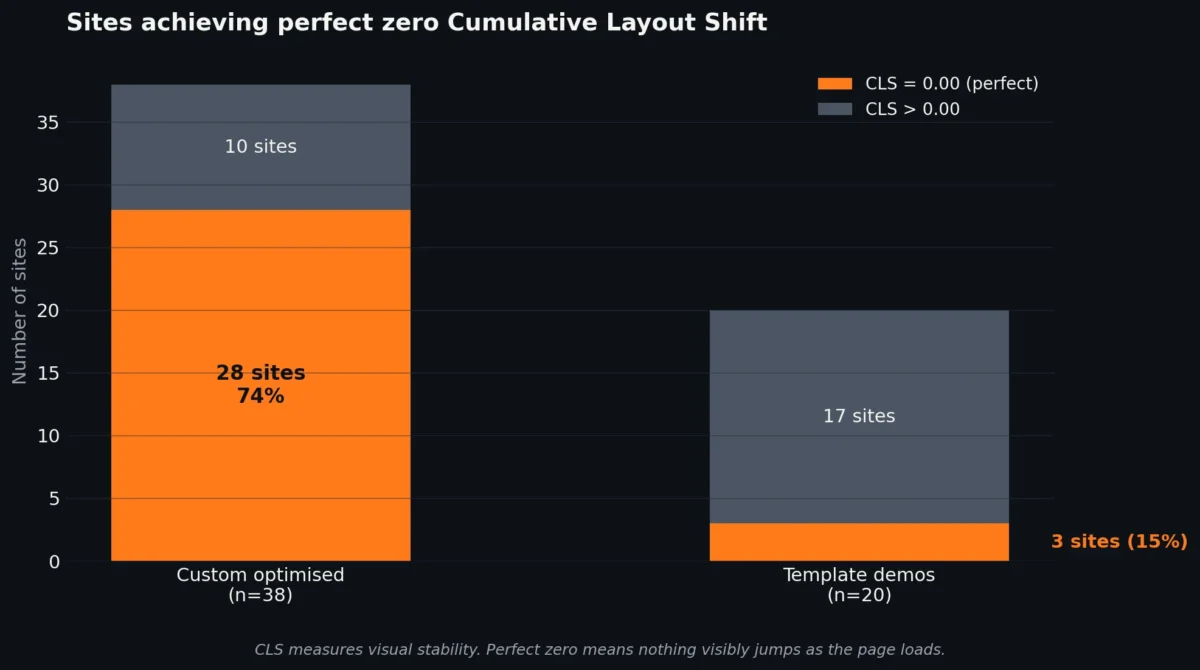
CLS measures visual stability – how much content jumps around as the page loads. A perfect score is 0.00.
| Group | CLS avg | CLS median | Sites with CLS = 0.00 |
|---|---|---|---|
| Custom (optimised, n=38) | 0.005 | 0.00 | 28 of 38 (74%) |
| Template / builder demos (n=20) | 0.087 | 0.03 | 3 of 20 (15%) |
Twenty-eight of thirty-eight optimised custom sites register a perfect zero CLS. This is not common on WordPress at this frequency. Template demos in the comparison set show CLS values up to 0.39 – nearly four times the “poor” threshold.
Interaction to Next Paint (INP)
INP field data is sparse because it requires sufficient real-user traffic to generate CrUX data, which most SME sites do not reach. Where available:
| Group | n with INP data | INP avg | INP median |
|---|---|---|---|
| Custom (optimised) | 5 | 82ms | 79ms |
| Template / builder demos | 11 | 152ms | 162ms |
Both averages sit within the “good” band (≤200ms), but the custom sample runs roughly twice as responsive. The templates sit closer to the “needs improvement” threshold of 200ms.
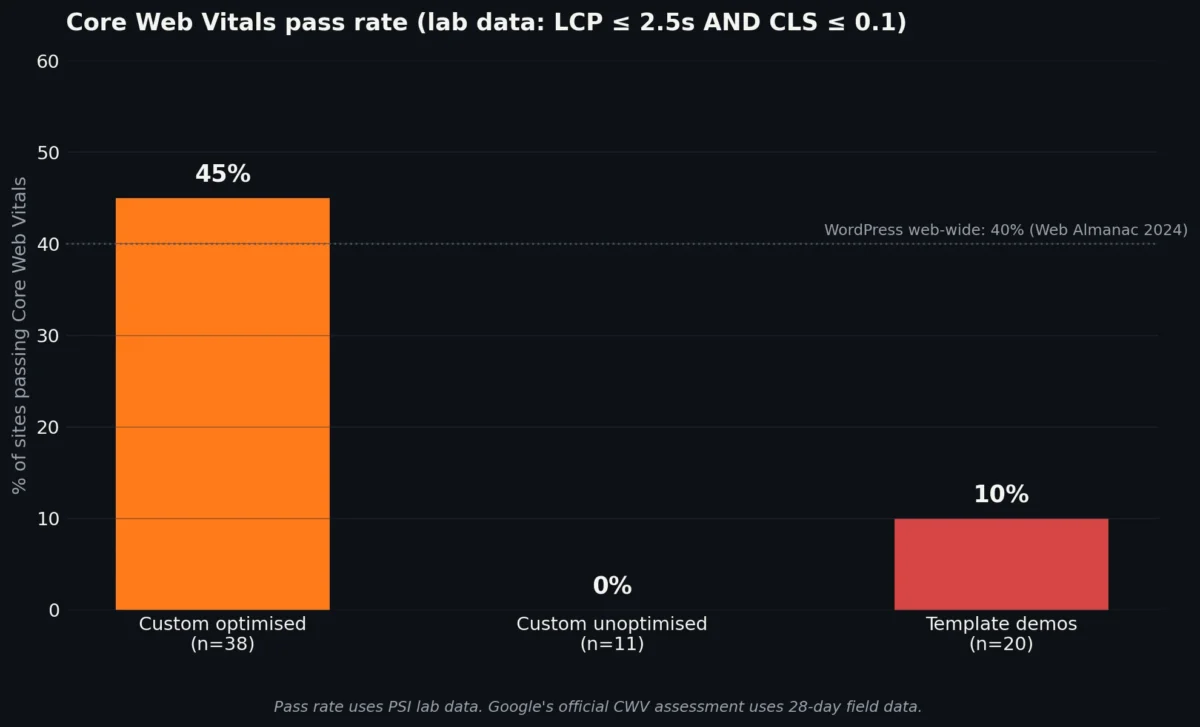
CWV pass rate (lab data)
A site is counted as passing CWV here if LCP ≤2.5s AND CLS ≤0.1 from lab data. INP is excluded due to limited field data availability. Official Google CWV assessment uses 28-day field data rather than single lab runs.
| Group | Passing | Evaluable | Pass rate |
|---|---|---|---|
| Custom (optimised) | 17 | 38 | 45% |
| Custom (unoptimised) | 0 | 11 | 0% |
| Template / builder demos | 2 | 20 | 10% |
Builder-level comparison within the template set
Within the template demo set, where labels were available:
| Builder | n | Avg PSI mobile |
|---|---|---|
| Elementor-labelled | 5 | 59.2 |
| WPBakery-labelled | 2 | 63.0 |
Two same-theme comparisons are worth noting. Theme “Buconz” is available in both WPBakery (Site 53) and Elementor (Site 54) versions – the WPBakery version scored 51 on mobile; the Elementor version scored 47. The Pixfort “Essentials” digital agency theme has a WPBakery demo (Site 57, PSI 75) and an Elementor demo (Site 58, PSI 78). On both theme pairs, the builder choice moves the score by only a few points – suggesting the performance ceiling is set by the template architecture itself, not by the specific builder.
Code weight and complexity
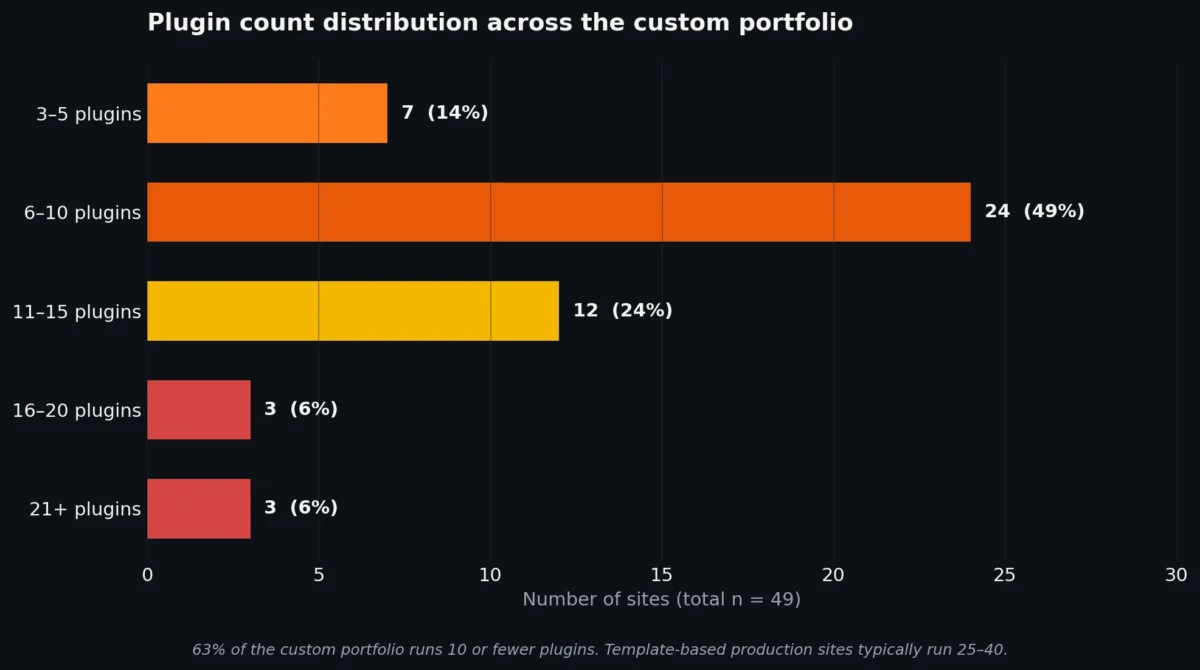
Plugin count distribution across the custom portfolio
| Plugin count range | Sites | Share |
|---|---|---|
| 3-5 plugins | 7 | 14% |
| 6-10 plugins | 24 | 49% |
| 11-15 plugins | 12 | 24% |
| 16-20 plugins | 3 | 6% |
| 21+ plugins | 3 | 6% |
Sixty-three per cent of the custom portfolio runs 10 or fewer plugins. Only six sites (12%) run 16 or more. For context, audit observations of production sites built on major page builders routinely show 25-40 plugins once the builder, its extensions, performance patches, security tools, and form handlers are installed.
The unoptimised custom subset averages 13.6 plugins versus 9.3 for the optimised subset – plugin creep correlates with performance decline within the custom sample itself. The worst performer in the portfolio (Site 47, 50 PSI mobile, 10.5s LCP) carries 38 plugins on a site that has not been updated in years.
Scale test: does custom hold up on large sites?
A common assumption is that template-based approaches are necessary for large sites. The data here suggests the opposite:
| Site | Pages | Plugins | PSI mobile | LCP | Sector |
|---|---|---|---|---|---|
| Site 43 | 2,832 | 12 | 90 | 0.64s | E-commerce |
| Site 24 | 11,342 | 5 | 91 | 2.8s | Media (news) |
| Site 10 | 585 | 13 | 90 | 1.14s | Construction |
| Site 47 (unoptimised) | 4,152 | 38 | 50 | 10.5s | Construction |
Three large custom sites (585 to 11,342 pages) hold 90+ mobile scores with sub-3-second LCP. Site 43 (an e-commerce catalogue with 2,832 pages) runs at 0.64s LCP – among the fastest scores in the entire portfolio. The outlier (Site 47) is a 4,152-page legacy site carrying 38 plugins without recent optimisation work, which illustrates that custom code alone is not sufficient; plugin discipline and ongoing maintenance matter.
Performance by sector
For sectors represented by at least two sites in the optimised subset:
| Sector | n | Avg PSI mobile |
|---|---|---|
| IT Services | 3 | 97.0 |
| Hospitality | 3 | 95.7 |
| Beauty | 4 | 95.0 |
| E-commerce | 2 | 94.5 |
| Creative Services | 2 | 90.0 |
| Services | 3 | 90.0 |
| Healthcare | 2 | 86.0 |
| Construction | 9 | 85.1 |
Construction sites average lower than other sectors – largely because construction sites tend to be image-heavy (project galleries, hero photography) and several in the sample have larger page counts. IT services, hospitality, and beauty sites average above 95 on mobile, which sits comfortably in Google’s “good” band.

Maintainability
The maintenance observations below are not measured with a timer – they are the practitioner’s record of time actually spent on each site over the past 12-24 months.
Custom builds in this portfolio require approximately 1-2 hours of maintenance per year. That figure covers WordPress core and plugin updates, a post-update sanity check, and occasional PHP compatibility adjustments when the hosting provider bumps versions. Some clients do not update their sites for multiple years and the sites continue to function normally.
Emergency fixes across the 49 custom sites over the past 24 months: zero. No site-down incidents, no catastrophic update failures, no “the site broke overnight” calls.
Template-based sites observed through client audits and migration work require substantially more. Based on observation:
- Major theme/builder updates arrive roughly once per quarter
- Each update cycle reasonably needs around 2 hours including a pre-update backup
- Annual maintenance load therefore sits around 8 hours, before counting any actual breakage
- When updates do break something, recovery is often difficult because page builders compile output through complex filter, shortcode, and block systems that resist manual fixes
A recurring pattern: clients who did not take backups before an update (which is most ordinary website owners) arrive asking for recovery of a site that can no longer be straightforwardly rebuilt from its own database. Page builder markup stored as shortcodes or JSON blobs does not always render correctly after a theme or builder version change.
The single most common cause of breakage observed on template-based sites is not WordPress itself. It is hosting-side changes (PHP version bumps, database engine upgrades) exposing incompatibilities in older builder code.
One maintenance category has grown meaningfully in 2025-2026: manual spam management. AI-driven bots are now solving CAPTCHAs at scale. Contact form submissions in the hundreds, and occasionally thousands, per week – all generated to look human – require site-by-site rule development. Automated blocking catches legitimate customers alongside bots, so the solution has to be curated per site.
For more detail on the maintenance and optimisation approach behind these results, see our WordPress speed optimisation checklist and Core Web Vitals optimisation checklist.
[IMAGE SUGGESTION 3 – maintenance] Prompt for Nano Banana 2: “Flat editorial illustration of a tidy toolbox on a desk next to a laptop, minimal line art style, warm neutral palette, conveys reliability and low-maintenance quality, no text, no branding”
Search visibility
Indexation and search performance data is drawn from Google Search Console access across the sites where the practice manages or monitors SEO.
- Indexation rates for custom sites typically sit between 80% and 100% of submitted URLs. Smaller brochure sites tend to reach full indexation. Larger sites with deep archive structures see partial indexation that correlates with content quality rather than technical barriers.
- Core Web Vitals in Search Console: the optimised custom subset mostly shows “Good” status. Sites that fail are predominantly the unoptimised older builds flagged earlier.
- Low Domain Authority with strong performance scores is the norm, not the exception. See the table below.
- Early LLM referral traffic has started appearing in 2025-2026 logs from sources that did not exist before (ChatGPT, Perplexity, and similar). Volumes are small and the dataset is not yet large enough to analyse, but the trend is consistent with the hypothesis that fast, clean, schema-rich sites surface in AI-driven discovery more often than heavier ones. This will be covered in a follow-up piece once sample size is sufficient.
Low DA, high performance pattern
Eighteen custom sites in the portfolio combine a Domain Authority under 20 with a PageSpeed Insights mobile score of 90 or higher:
| Site example (sector) | DA | PSI mobile |
|---|---|---|
| Beauty | 15 | 96 |
| Beauty | 11 | 98 |
| Hospitality | 12 | 99 |
| E-commerce | 4 | 99 |
| Archives | 3 | 95 |
| Construction | 1 | 94 |
| Creative Services | 1 | 100 |
| Services | 1 | 97 |
| E-commerce | 1 | 90 |
| (plus 9 more sites with DA < 20, PSI mobile ≥ 90) |
Several of these sites generate steady organic enquiries despite modest DA – a pattern the practitioner attributes to the combination of clean technical foundations, complete schema coverage, and strong page speed, which appears to carry disproportionate weight for local service businesses competing in niches where larger competitors run slower sites.
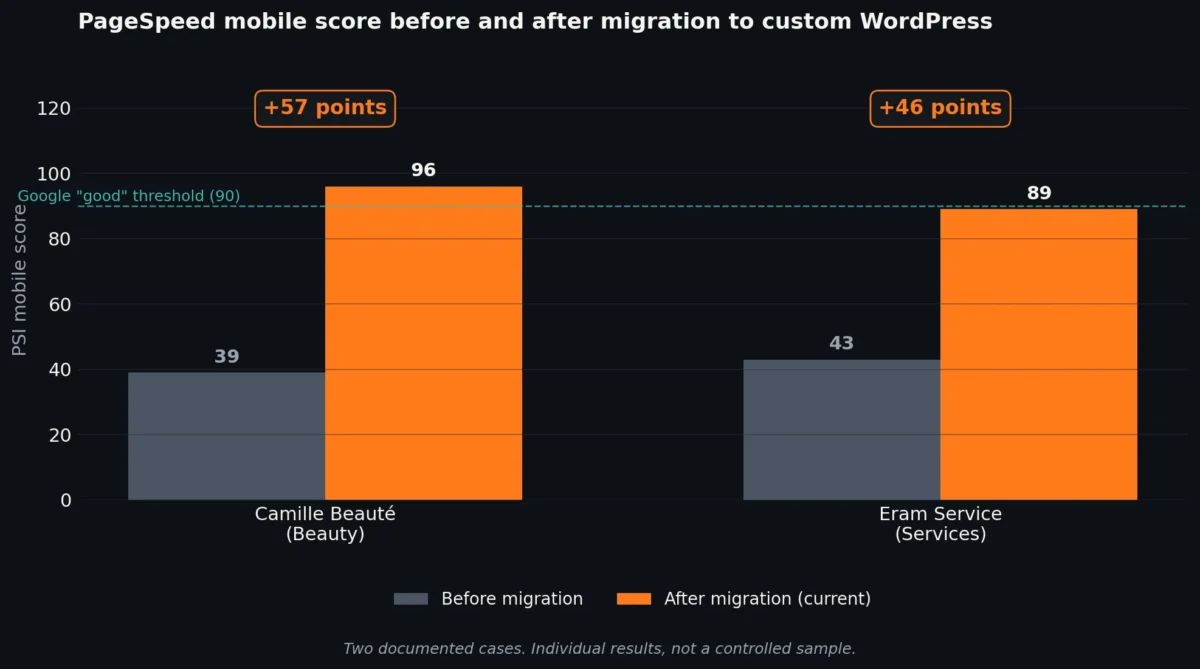
Migration before/after
Two documented migrations from template-based to custom WordPress:
| Site | Sector | PSI Mobile before | PSI Mobile after (current) | Notes |
|---|---|---|---|---|
| Camille Beauté | Beauty | 39 | 96 | Immediate organic search improvement observed in GSC following migration |
| Eram Service | Services | 43 | 89 | Sustained growth in organic enquiries post-migration |
These are individual cases, not a controlled sample. They are included as illustrative evidence of the performance delta achievable on migration rather than as proof of a rule.
For deeper context on platform choice, see WordPress vs other platforms in 2026.
Key findings
- Optimised custom WordPress sites in this portfolio average 89.9 PSI mobile, essentially at Google’s “good” threshold. The comparison set of template/builder demo sites averages 53.9 on the same metric – a gap of roughly 36 points measured under conditions that favour templates.
- 45% of optimised custom sites pass CWV on lab data; 10% of template demos do. Unoptimised older custom builds pass at 0%, confirming that custom code alone is not sufficient – ongoing optimisation matters.
- 74% of optimised custom sites show perfect zero CLS versus 15% of template demos. Layout stability is where the gap is widest.
- Zero template demos scored 90+ on mobile PSI despite running as showcase installations. This is the single strongest data point in the study.
- INP runs roughly twice as responsive on custom sites where field data is available (82ms vs 152ms average).
- Maintenance load is approximately 1-2 hours per year on custom builds versus roughly 8 hours per year on template-based sites, with higher breakage risk on the template side.
- Zero emergency fixes across 49 custom sites over 24 months. Template-based sites routinely arrive in the agency’s inbox with update-related damage requiring recovery.
- Custom builds scale. Sites of 585, 2,832, and 11,342 pages all hold 90+ mobile scores with sub-3-second LCP.
- 63% of the custom portfolio runs 10 or fewer plugins. Template-based production sites observed through audits routinely run 25-40.
- Low-DA custom sites rank and convert well. Eighteen sites in the portfolio combine DA under 20 with PSI mobile of 90 or higher. Technical foundations appear to carry substantial weight for small and medium-sized businesses in competitive local sectors.
Methodology and limitations
Data was collected on 19 April 2026 using Google PageSpeed Insights (lab data for all metrics; CrUX field data where available for INP). Domain Authority figures are from Moz. Indexation and CWV pass rates were reviewed in Google Search Console where the practice has access. Maintenance figures are the practitioner’s records of time spent per site across the past 12-24 months.
Limitations to note:
- This is a single-practitioner portfolio sample. It is not randomised and carries the biases of one studio’s development practices.
- The comparison set is theme author demo sites, not matched production sites. Demo sites represent best-case template performance; real production sites built on the same templates typically perform worse. The direction of this bias favours templates in our measurements, so the real-world gap is likely larger than reported here.
- Sample size (n=49 custom, n=20 template demos) is sufficient for directional findings but not for statistical claims requiring larger samples.
- Sector distribution is uneven and reflects the practice’s client base.
- PSI scores are from single lab runs and vary by a few points between runs. Single-measurement data should be read directionally.
- INP field data was only available for 5 custom sites and 11 template demos due to CrUX traffic thresholds. The INP comparison should be read with this small sample in mind.
- CWV pass rate calculation here uses lab data for LCP and CLS. Google’s official CWV assessment uses 28-day field data, which was not systematically available for most sites in the sample.
- Unoptimised sites within the custom portfolio are flagged where the practitioner recalls the build context; there may be other sites where optimisation fell behind over time that are not labelled.
Despite these limitations, the direction and size of the effects are consistent enough across 69 sites to suggest the general pattern – custom builds outperform template/builder sites on measurable performance and require meaningfully less maintenance – is real.
Related publications
Research papers based on this data will be linked here upon publication.
https://zenodo.org/records/19697029
About the author
Ernest K. is a web designer and developer based in London with over 20 years of experience in web development, SEO, and digital marketing. He has built more than 100 websites for small and medium-sized businesses across a range of sectors. He runs Web Designer London, a practice specialising in custom WordPress development, Core Web Vitals performance, and long-term search visibility for service-based businesses. For enquiries, see the contact page.