Custom WordPress Site Speed: Hosting vs Optimisation Compared
A four-phase test on an 8-year-old WordPress site for fortengineering.co.uk, a UK security door manufacturer. New host, full optimisation, both, plus cache variants. What each step actually delivered.
At a glance
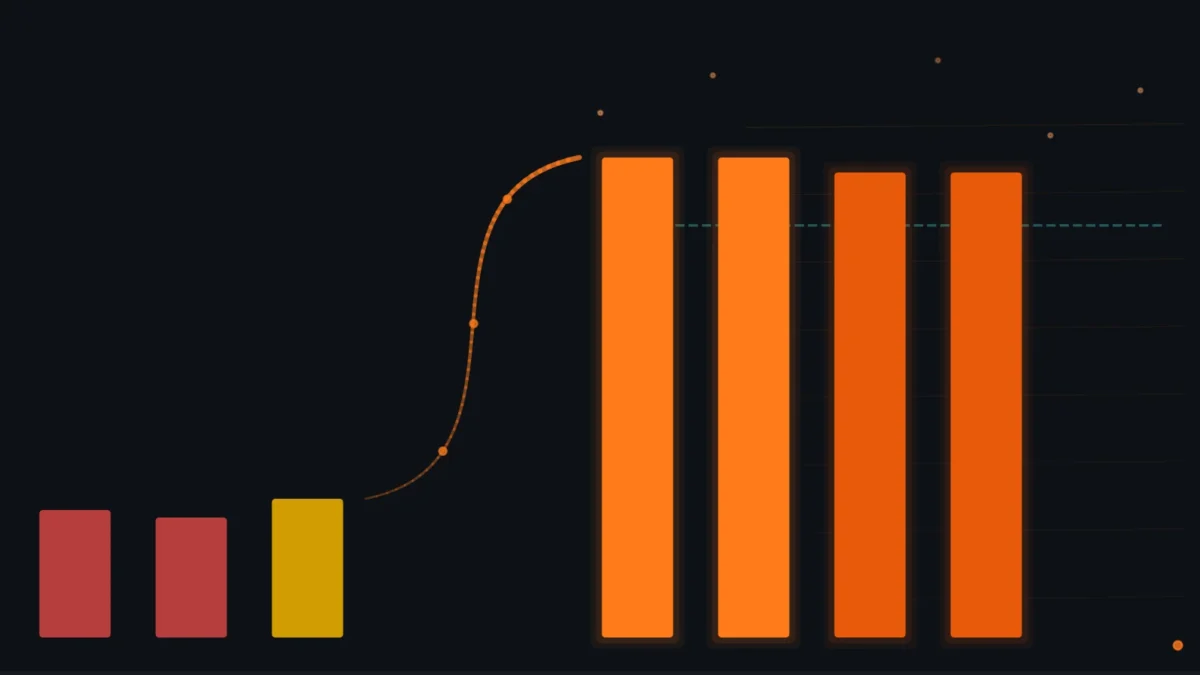
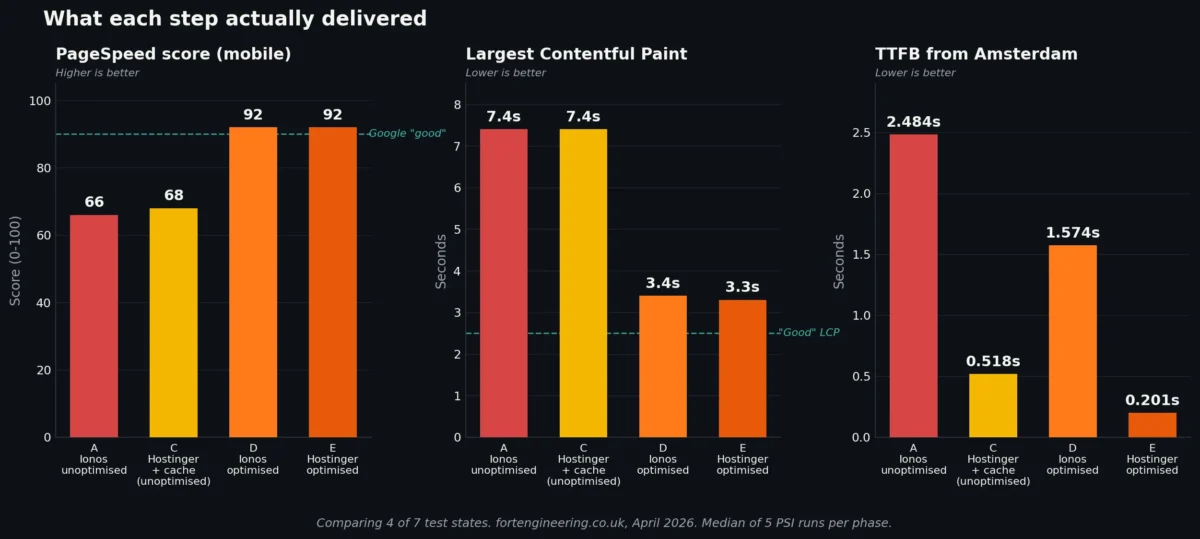
The site started at PSI mobile 66 on its original host with no optimisation. After moving hosts: 64. After full optimisation on the original host: 92. After both: 92. After both with caching: 90.
The headline finding: optimisation work on the existing host delivered the entire score gain. Hosting alone delivered almost nothing on PageSpeed Insights, but it transformed Time to First Byte from 2.5 seconds to under 0.2. The two changes do different things, and most published advice conflates them.
The site owner asked the question many SMEs ask: should I move hosts, or pay someone to optimise the site? We tested both, separately and together.
Why this case study exists
Web hosting marketing in 2026 still leads on speed. Faster servers, edge caching, premium tiers. The implication is that switching hosts is the natural first move when a WordPress site feels slow. The site owner at fortengineering.co.uk had been hearing that pitch from multiple directions and asked us directly: would changing the host fix it?
The site is 8 years old. WordPress 5.2.4 (released October 2019). 14 active plugins. A custom theme last updated in version 1.1. Database 80 MB. Uploads folder 212 MB. Homepage weight 1.95 MB. Mobile PSI 66. By any reasonable measure, mediocre but functional.
The honest answer to “will switching host fix it” needed evidence rather than assumption. So we designed a test that could isolate hosting effect from optimisation effect, ran the comparisons, and recorded everything.
This is the case study from that test. It is a single-site write-up – n=1 – and it is presented as a worked example rather than as research. Practitioner research at portfolio scale is published separately at webdesigner.london/wordpress-development-research/.
The site we tested
Site: fortengineering.co.uk
Sector: UK security door manufacturer
Permission: the site owner agreed to the test and the public write-up before any work started.
Site profile at start of test:
- Age: 8 years
- WordPress version: 5.2.4 (released 2019)
- Theme: Fortengineering v1.1 (custom)
- PHP version on host: 7.3
- Active plugins: 14
- Pages: 21
- Database size: 80 MB
- Uploads folder: 212 MB
- Homepage weight: 1.95 MB
- Total requests on homepage: 53
- CDN: none
This is a typical small business WordPress site that has been left to run quietly for years. Nothing was visibly broken. The owner could update content. Search Console flagged Core Web Vitals as needing improvement but the site had not received the kind of attention required to address that.
Test methodology
We tested the site in seven distinct states, designed to isolate each variable.
Phase A – Ionos / Fasthosts hosting, site unoptimised. The starting condition.
Phase B – Hostinger hosting, site unoptimised, no caching. Same site, new host, no other changes.
Phase C – Hostinger hosting, site unoptimised, Hostinger native cache active. New host with their default caching.
Phase D – Ionos hosting, site fully optimised. Original host, but the site rebuilt for performance.
Phase E – Hostinger hosting, site fully optimised, no caching. New host plus full optimisation, no cache layer.
Phase F – Hostinger hosting, site fully optimised, Hostinger native cache active. Full stack with native caching.
Phase G – Hostinger hosting, site fully optimised, caching plugin active (Hostinger native cache disabled). Full stack with plugin-based caching.
Each PSI score is the median of five runs. Single PSI measurements vary by 10-20 points run to run, which makes them unusable for any comparison. The five-run median rule is the floor for honest measurement.
Test URLs were the same three throughout: the homepage, an inner page (/security-doors/), and a heavy page (/gallery/). After optimisation, only the homepage was retested across all four optimised states. Inner page and heavy page have data only for the unoptimised states. This is a known limitation of the dataset.
No CDN was active during any test. Adding Cloudflare or similar during a hosting comparison masks the actual hosting difference.
Tools used: PageSpeed Insights (pagespeed.web.dev), WebPageTest (Los Angeles and Amsterdam locations), GTmetrix (Seattle), Chrome DevTools, SSL Labs, WP Performance Tester. Test dates: 24-25 April 2026.
A side note on plugin updates worth recording: when WordPress core was updated from 5.2.4 to current, several plugins broke because their authors had abandoned them years earlier. Their functionality had to be rebuilt manually. This is one of the hidden costs of leaving a WordPress site untouched for too long – the plugin ecosystem moves on, and abandoned plugins become liabilities the next time core needs updating.
What “optimisation” actually meant on this site
Before getting into the comparison data, it is worth being honest about what the optimisation work in Phase D involved. “Optimisation” is a soft word that gets used to mean anything from “installed a caching plugin” to “rebuilt the entire front-end.” On this site, it sat closer to the second.
The work took roughly four hours. The changes were:
- WordPress core updated from 5.2.4 to current (a 6.5-year jump)
- PHP upgraded from 7.3 to 8.4
- Active plugins reduced from 14 to 2
- Database cleaned and optimised: 80 MB to 27 MB (a 66% reduction)
- Bespoke navigation rebuild replacing a plugin-based menu system
- Custom header and footer modules replacing template-based equivalents
- Manual image processing pipeline replacing the previous compression plugin
- Bespoke font loading replacing a plugin-handled font system
- Several smaller component-level rebuilds for performance-critical areas
The 12 plugins that were removed were not replaced by other plugins. Their functionality was rebuilt as code specific to this site. Most of the work was reading what the existing plugins were doing and writing leaner replacements. There is no plugin or service that turns a 14-plugin site into a 2-plugin site automatically. That work is manual.
This is custom WordPress development applied to an existing site, rather than productised optimisation in the usual sense. The specifics of which functions were rebuilt and how are available on request.
The four-hour figure is the pure development time. It excludes hosting setup, the initial diagnostic audit, and the post-work testing rounds. At standard development rates, the work would represent several hundred pounds of billable time. Calling it “free” because the site owner can do it themselves would be misleading – the work requires skills that productised optimisation services do not deliver.
Headline results
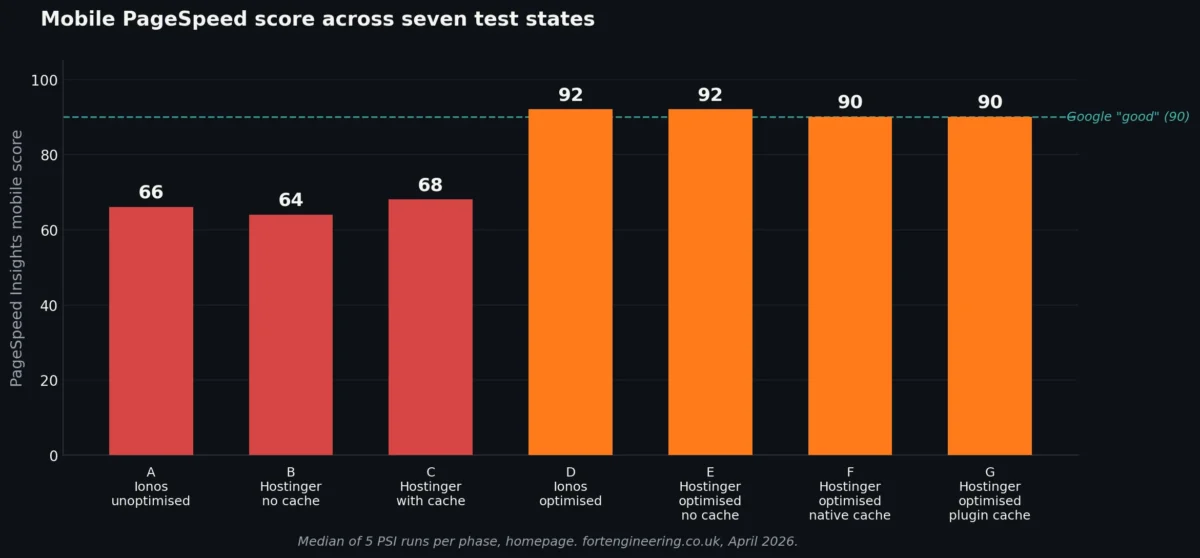
Mobile PageSpeed Insights scores across all seven test states, homepage:
| Phase | State | PSI Mobile |
|---|---|---|
| A | Ionos, unoptimised | 66 |
| B | Hostinger, unoptimised, no cache | 64 |
| C | Hostinger, unoptimised, with native cache | 68 |
| D | Ionos, optimised | 92 |
| E | Hostinger, optimised, no cache | 92 |
| F | Hostinger, optimised, with native cache | 90 |
| G | Hostinger, optimised, with caching plugin | 90 |
Three things stand out in this table.
First, hosting alone (A to B and A to C) does effectively nothing for the PageSpeed score on this site. The numbers move within the noise band of PSI variance.
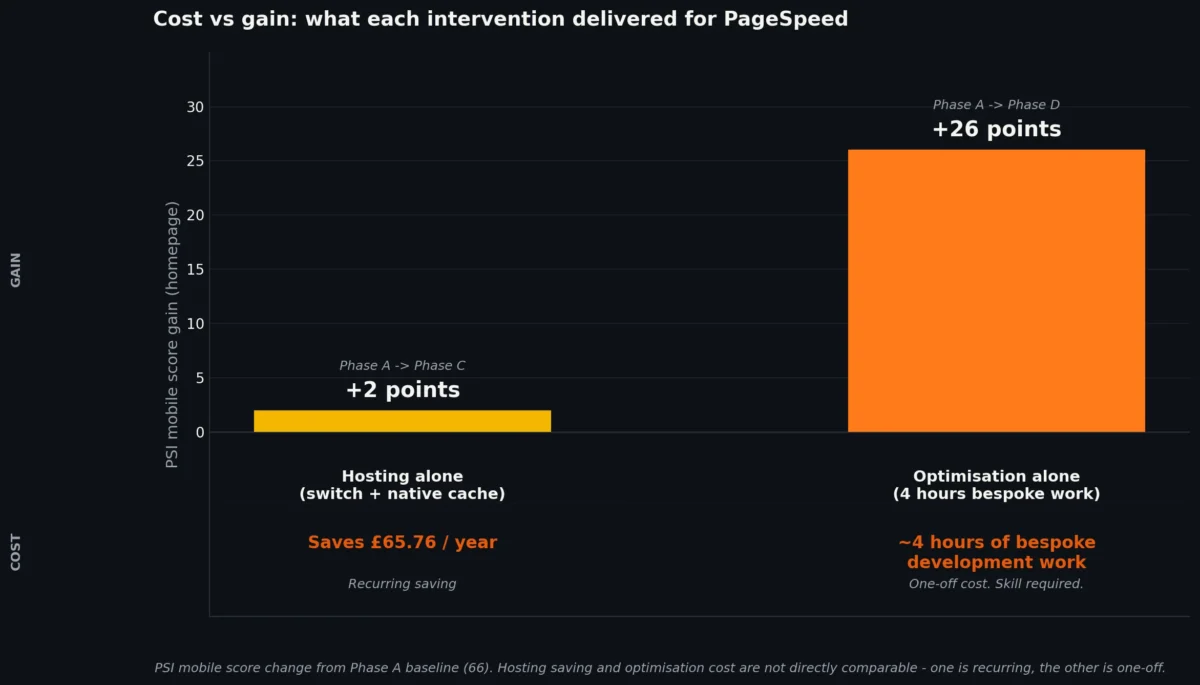
Second, optimisation alone (A to D) moves the score 26 points on the original host. That single column shift is the entire transformation.
Third, once the site is optimised, the host barely matters for PSI score (D and E both score 92). And once optimisation is done, adding cache slightly reduces the score (E to F to G). PageSpeed’s weighting is doing something specific here that we will return to below.
Hosting alone: what changing host without changing the site delivered
Phases A, B, and C compare the same site – unoptimised, untouched – across three hosting configurations.
| Metric | A: Ionos | B: Hostinger no cache | C: Hostinger native cache |
|---|---|---|---|
| PSI Mobile (homepage) | 66 | 64 | 68 |
| Homepage LCP | 7.4s | 7.4s | 7.4s |
| TTFB Amsterdam | 2.484s | 0.184s | 0.518s |
| Speed Index Amsterdam | 3.561s | 1.474s | 1.752s |
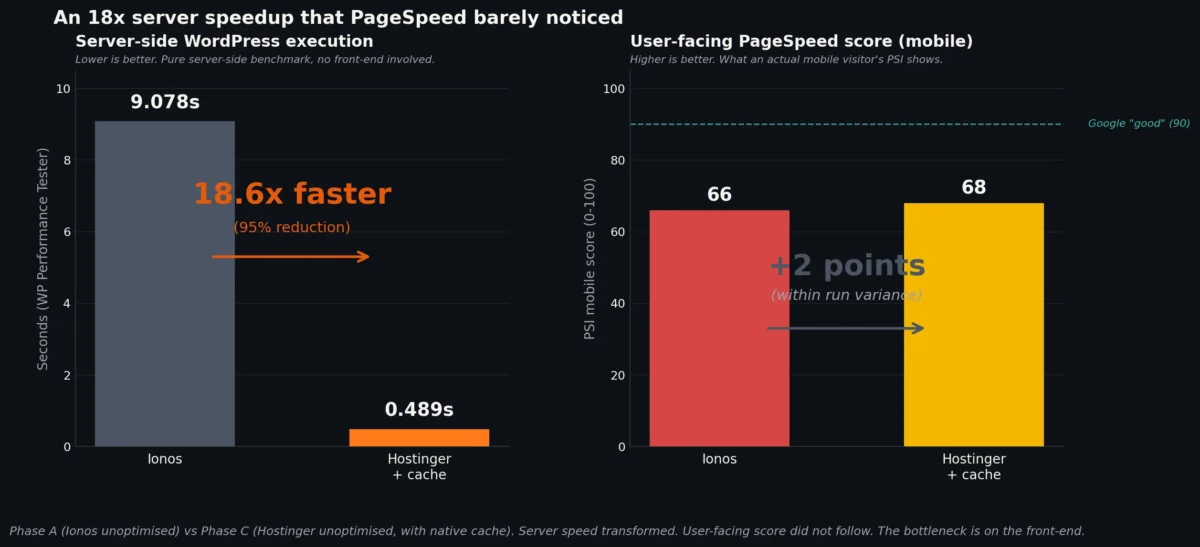
| WP execution benchmark | 9.078s | 0.489s | 0.489s |
| MySQL query benchmark | 32.302s | 6.076s | 6.076s |
The TTFB transformation is dramatic. Amsterdam users see a server response time of 184 milliseconds on Hostinger, compared with 2,484 milliseconds on Ionos. That is a 13-fold improvement. WordPress execution benchmarks show Hostinger running PHP code 18 times faster on this codebase. MySQL benchmarks show a 5-fold improvement in database performance.
But the user-facing PageSpeed Insights mobile score barely moves. 66 to 64 is within run-to-run variance. 66 to 68 with caching is a marginal positive.
This is the central finding of the hosting-alone comparison. The server is dramatically faster. The site, as measured by PageSpeed Insights, is not. Why?
The answer is in the page itself. The homepage transferred 2 MB across 53 requests with the front-end built around plugins, render-blocking JavaScript, and unoptimised images. Once the request reaches the browser, the bottleneck shifts away from the server entirely. The browser is doing the slow work – parsing JavaScript, calculating layouts, decoding images – and the server’s contribution to that timeline is minimal.
If your site’s front-end is heavy, faster hosting cannot rescue your PageSpeed score. The bottleneck is not where the marketing implies it is.
There is one nuance worth noting. The inner page (/security-doors/) actually got slower in lab testing on Hostinger without caching – LCP went from 5.4 seconds on Ionos to 13.6 seconds on Hostinger no-cache, with TBT jumping from 70ms to 430ms. The same page on Hostinger with cache active recovered to 5.1 seconds. This suggests Hostinger’s dynamic-page performance without their caching layer is not automatically faster than Ionos for this kind of content. The native cache is doing real work.
Optimisation alone: what 4 hours of bespoke work delivered on the original host
Phase D kept the site on Ionos. Same hosting, same hardware, same network path. Only the site itself changed.
| Metric | A: Ionos unoptimised | D: Ionos optimised | Change |
|---|---|---|---|
| PSI Mobile (homepage) | 66 | 92 | +26 |
| Homepage LCP | 7.4s | 3.4s | -54% |
| Homepage FCP | 4.0s | 1.0s | -75% |
| Homepage Speed Index | 3.8s | 2.7s | -29% |
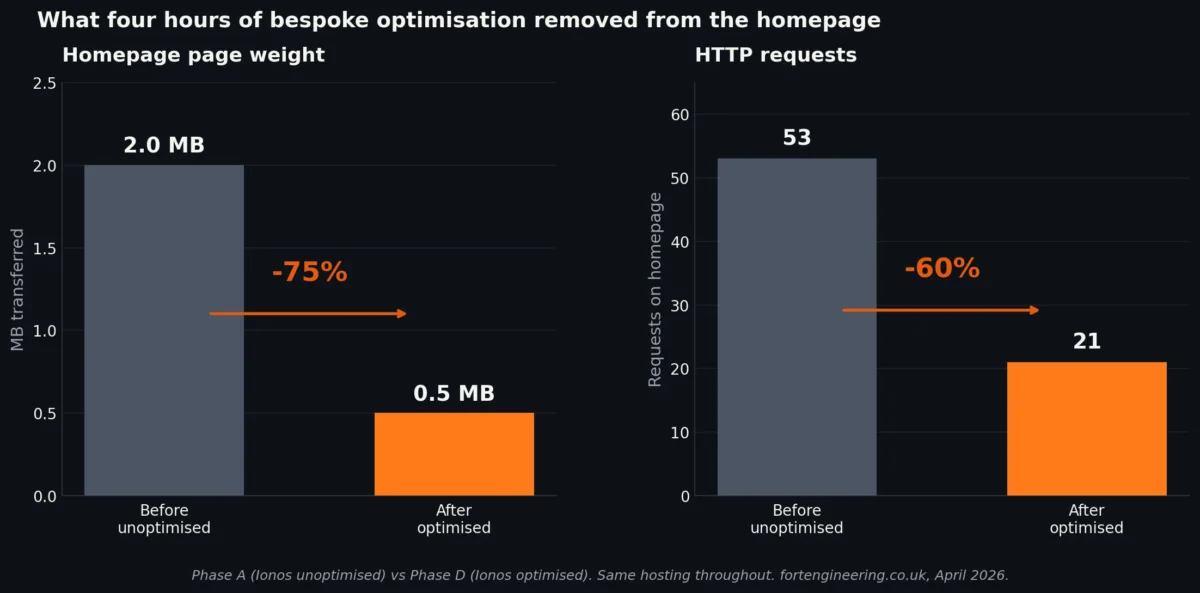
| Page weight transferred | 2.0 MB | 0.5 MB | -75% |
| Total requests | 53 | 21 | -60% |
| TTFB Amsterdam | 2.484s | 1.574s | -37% |
| Database size | 80 MB | 27 MB | -66% |
| Active plugins | 14 | 2 | -86% |
The 26-point PageSpeed gain is real, measurable, and came from the work on the site rather than anything about the hardware running it.
The page is now 75% lighter. It loads with 60% fewer requests. The database is a third of its previous size. Twelve plugins were removed and either had their functionality rebuilt as code specific to this site or were judged unnecessary in the first place.
The TTFB improvement on Ionos here (2.484s to 1.574s) is also worth noting. It is the same hosting, the same server. But fewer database queries, smaller database, and modern PHP all reduce the time the server needs to assemble the page. Optimisation work on the site improves what the server has to do, which improves TTFB even when the server itself is unchanged.
This phase is the case study’s most important finding for site owners weighing their options. The improvement available from working on the site, on the existing host, was substantial. The improvement available from changing the host without working on the site was negligible for this metric.
Combined: what hosting and optimisation delivered together
Phase E moved the optimised site to Hostinger. The expectation might be that combining a fast host with a fast site would deliver compounding gains.
| Metric | D: Ionos optimised | E: Hostinger optimised, no cache |
|---|---|---|
| PSI Mobile (homepage) | 92 | 92 |
| Homepage LCP | 3.4s | 3.3s |
| TTFB Amsterdam | 1.574s | 0.201s |
| Speed Index Amsterdam | 1.896s | 0.596s |
The PageSpeed score did not change. LCP improved by 100 milliseconds. The metrics that PSI weights heavily had already been pushed close to their floor by the optimisation work, and the faster server could not extract more.
But TTFB dropped from 1.574 seconds to 201 milliseconds in Amsterdam. Speed Index dropped from 1.896 seconds to 596 milliseconds. These are real improvements that real users would feel. PageSpeed Insights just does not weight them heavily once the lab metrics it uses are already in the green band.
The honest reading: combining optimisation with better hosting on this site produced no further PSI gain, but produced a meaningfully better real-user experience for visitors outside the UK. If the metric you care about is the PageSpeed score, hosting matters less than optimisation. If the metric you care about is how fast the page actually feels for users on slower networks or further from the server, hosting matters a great deal.
Cache variants: native cache, plugin cache, no cache
After optimisation on Hostinger, we tested three cache configurations.

| Metric | E: No cache | F: Hostinger native cache | G: Caching plugin |
|---|---|---|---|
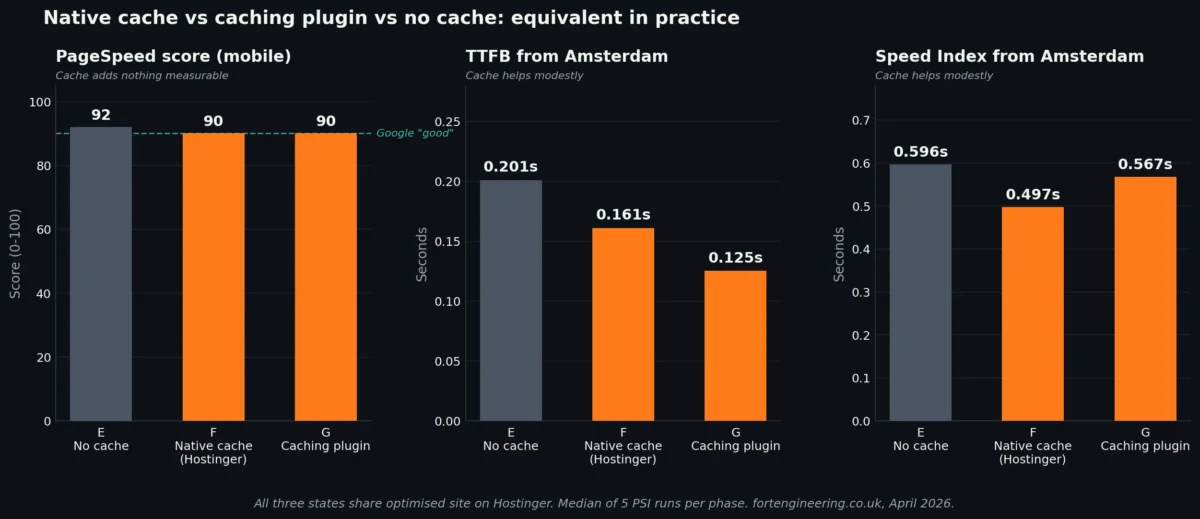
| PSI Mobile (homepage) | 92 | 90 | 90 |
| Homepage LCP | 3.3s | 3.3s | 3.3s |
| Homepage FCP | 1.1s | 1.1s | 1.1s |
| TTFB Amsterdam | 0.201s | 0.161s | 0.125s |
| Speed Index Amsterdam | 0.596s | 0.497s | 0.567s |
| LCP Amsterdam | 0.593s | 0.494s | 0.579s |
Three observations from this comparison.
PageSpeed score does not differentiate between these three states in any meaningful way. 92 versus 90 is within run-to-run variance.
TTFB and Speed Index improve modestly with cache active, regardless of whether the cache is the host’s native layer or a plugin running inside WordPress. The improvements are in the 10-40% range on these metrics, which is meaningful for real users without being transformational.
The native Hostinger cache and the caching plugin perform almost identically. The plugin is marginally faster on TTFB. The native cache is marginally faster on Speed Index. The differences are small enough that the choice is operational rather than performance-based – native cache is one less moving part, the plugin is more portable across hosts.
For site owners asking “do I need a caching plugin if my host has cache built in?” – the honest answer from this dataset is that they perform equivalently on a properly optimised site. Either is fine. Neither delivers transformational gains over no-cache when the site itself is already lean.
The /gallery/ page collapse
The heavy page on this site – /gallery/ – tells a separate story worth highlighting.
| Phase | Gallery LCP |
|---|---|
| A: Ionos unoptimised | 41.4s (median of 4 runs, range 34.7-50.6s) |
| B: Hostinger unoptimised, no cache | 24.2s |
| C: Hostinger unoptimised, with cache | 6.5s |
The gallery page LCP on the original Ionos setup was 41 seconds. Forty-one seconds. The page was technically loading, but the largest content paint was happening only after most users would have abandoned the page.
Hosting alone (A to B) reduced LCP to 24 seconds. Adding the host’s native cache (A to C) brought it down to 6.5 seconds, a reduction of 84% from baseline.
The PageSpeed score for this page only moved 9 points across these three states (60 to 60 to 69), which understates what is actually happening. PSI’s mobile scoring formula penalises poor LCP heavily but caps the gain available once a page is below a certain threshold. A page that goes from “catastrophically slow” to “merely slow” can show large LCP improvements with modest score movement.
The gallery page was not retested in optimised states – this is a gap in the dataset that future work could fill. But the unoptimised data alone shows that for image-heavy pages, the combined effect of better hosting and active caching can be the difference between a page that loads in a usable timeframe and one that effectively does not.
PageSpeed score variance: a methodology note
A note that doubles as a public service. PSI scores vary substantially between consecutive runs of the same URL on the same site at the same time of day. Without medians from multiple runs, single PSI measurements are misleading.
Five run sample, Phase G, homepage:
| Run | Score |
|---|---|
| 1 | 90 |
| 2 | 91 |
| 3 | 93 |
| 4 | 77 |
| 5 | 90 |
The fourth run came back at 77. Runs 1, 2, 3, and 5 were 90, 91, 93, 90. A single measurement that happened to land on run 4 would have produced a 16-point lower number than the median. A single measurement that happened to land on run 3 would have produced a 3-point higher number than the median.
The median of these five runs is 90. That is the honest figure. Single PSI runs can land 13 points either side of the median for a stable site under stable conditions.
This matters because most online discussions of WordPress performance use single-run PSI numbers. Comparisons between hosts, between plugins, between optimisation strategies – much of it is built on data that is within the variance band of the measurement tool. Until measurements are taken with consistent methodology and median values from multiple runs, claims about differences should be read with caution.
Reliability and the cost of obstructive hosting
The case study set out to measure speed. It accidentally produced data on something else worth recording.
During the optimisation work, the original Ionos hosting created a series of obstacles that had nothing to do with speed and everything to do with whether the work was practical to do at all.
WordPress core auto-update failed with a cURL error 60: “Peer’s Certificate issuer is not recognized.” The CA bundle on the Ionos server was outdated. The fix would normally be a php.ini adjustment, but php.ini is not accessible through the Ionos control panel. The workaround was to upload the WordPress core files manually via FTP. Working over FTP on Ionos was slow and frustrating.
The WordPress theme and plugin file editor was non-functional. Attempts to save changes returned “Unable to communicate back with site to check for fatal errors” – a loopback request failure caused by Ionos’s own configuration. Edits made through wp-admin were silently reverted. All file changes had to be made via FTP.
SSL Labs reported “Chain issues: Incorrect order” on the Ionos certificate configuration – a server-side configuration error, separate from the cURL error but the same flavour of issue. The Ionos infrastructure was generally not being maintained to current standards.
The MySQL database was hosted at a separate IP address (213.171.200.102) rather than locally. Every database query traversed a network hop. This contributed to both the high TTFB and the slow MySQL benchmark.
WP-Cron and scheduled tasks were unreliable due to the loopback failure, which also affects Site Health checks and various plugin background processes.
By contrast, the same site on Hostinger had local MySQL, a working file editor, working auto-updates, accessible PHP configuration, and a clean SSL chain.
The reliability issues are not visible in PageSpeed scores. They are visible in how much effort it takes to maintain or improve a site. On Ionos, basic maintenance work was a constant fight against the host’s own configuration. On Hostinger, the host got out of the way.
For a working site that nobody touches, this difference may not matter. For a site that needs ongoing development, optimisation, or even routine updates, it matters substantially. This is a hidden cost of bargain shared hosting that does not appear on any feature comparison.
Cost breakdown
The economics of this case study are clean enough to lay out plainly.
Hosting:
- Ionos Momentum Web Hosting with boost: £14.48/month, £173.76/year
- Hostinger Business Web Hosting: £9/month, £108/year (4-year contract for the advertised price)
- Annual saving: £65.76
Optimisation work:
- Approximately 4 hours of bespoke development time
- At standard rates this represents a meaningful one-off cost
- Required skills: WordPress theme development, PHP, image optimisation workflows, plugin replacement, database management
The trade-off in practice:
Site owners considering this kind of work face a real choice. Switching hosts is cheap, fast, and recurring (saves money every year). The optimisation work is expensive once and free thereafter. From a pure PageSpeed perspective, the expensive option delivered the result. The cheap option delivered something else – faster TTFB, fewer maintenance headaches, better day-to-day reliability – but did not move the score that most people optimise for.
A reasonable framing: if PageSpeed is the goal, optimisation is essentially the only path. If maintenance friction and real-user experience matter, hosting matters too. Neither alone is sufficient if the site is in the condition this one started in.
What this means for site owners
A practical decision framework based on this case study and the wider portfolio research.
If your site loads in under 3 seconds and PSI is already in the 80s, you may not need either intervention. Marginal improvements are available from both hosting and optimisation, but the value is lower.
If your site loads slowly and you have not optimised in years, start with optimisation. The gain available from working on the site itself is substantially larger than the gain available from switching hosts. The work is not cheap and does require skill, but the result is durable.
If you are happy with current performance but are facing maintenance friction, consider the host. Reliability, support, control panel quality, and infrastructure modernisation matter even when PSI scores are fine.
If you are planning a redesign or rebuild, consider both, sequenced. Move the host first to get the maintenance environment right. Then do the development work in a hosting environment that is not actively obstructing it.
Switching hosts as the primary speed intervention is often a poor use of time and money for sites in the condition this one started in. The marketing implies otherwise. The data does not support the marketing.
Methodology and limitations
Honest disclosure of what this case study can and cannot support.
Sample size is one. This is a single site, in a specific sector, with a specific theme, in a specific configuration. Findings are directional rather than representative. Wider portfolio research is published at webdesigner.london/wordpress-development-research/.
Optimised state was tested only on the homepage. The /security-doors/ and /gallery/ pages have data only for the unoptimised states. A complete dataset would test all three URLs in all seven phases.
No CDN was used in any test. Adding a CDN would mask hosting differences and was deliberately excluded. Real production sites often run a CDN; results here represent the underlying hosting performance only.
Field data (CrUX) is unavailable for this site. Traffic volumes are below the threshold required for Chrome User Experience Report data. All Core Web Vitals figures here are lab data from PageSpeed Insights, which differs from the field data Google uses for ranking signals.
A minor CLS regression was introduced by the optimisation work. Pre-optimisation CLS was 0.000 on the homepage; post-optimisation it is 0.013. This is well within the “Good” threshold (under 0.1) but represents a regression worth investigating. Likely candidates: a lazy-loaded image without explicit dimensions, or a font-swap event during page render.
PHP version was not isolated as a variable. Ionos tests ran on PHP 7.3, Hostinger on PHP 7.4 initially and 8.4 after optimisation. The PHP version effect cannot be cleanly separated from the host effect or the optimisation effect.
The original 4-phase test plan expanded to 7 distinct test states during execution. Cache variants were added as the data emerged. This is normal practitioner methodology but worth noting transparently.
TTFB measurements are from single locations (Los Angeles and Amsterdam via WebPageTest). They are representative but not exhaustive.
Single-day measurement window. All testing took place on 24-25 April 2026. Results may vary at different times of day or under different network conditions.
Related research
This case study is a single-site companion to the broader practitioner research published at webdesigner.london/wordpress-development-research/, covering 49 custom WordPress sites against a comparison set of 20 template and page builder demos. That paper is also archived at Zenodo with a permanent DOI: 10.5281/zenodo.19697029.
For the technical detail behind individual optimisation steps, see the WordPress speed optimisation checklist and the Core Web Vitals optimisation checklist.
About the site
fortengineering.co.uk is a UK manufacturer of security doors and physical security products. The site has been running on WordPress since 2018. The owner agreed to participate in this case study, including the public write-up, before any work began. Specific implementation details of the bespoke replacements built during the optimisation phase are available on request via the contact page.